Features Showcase How To Use Install Help Portfolio ↗
IntelliJ IDEA · Android Studio

MINDMAP

Click any function. See everything that calls it and everything it calls. No digging, no guessing.

Scroll

What is it

Understand Your
Call Graph

Instant call chain visualization, right inside your IDE.

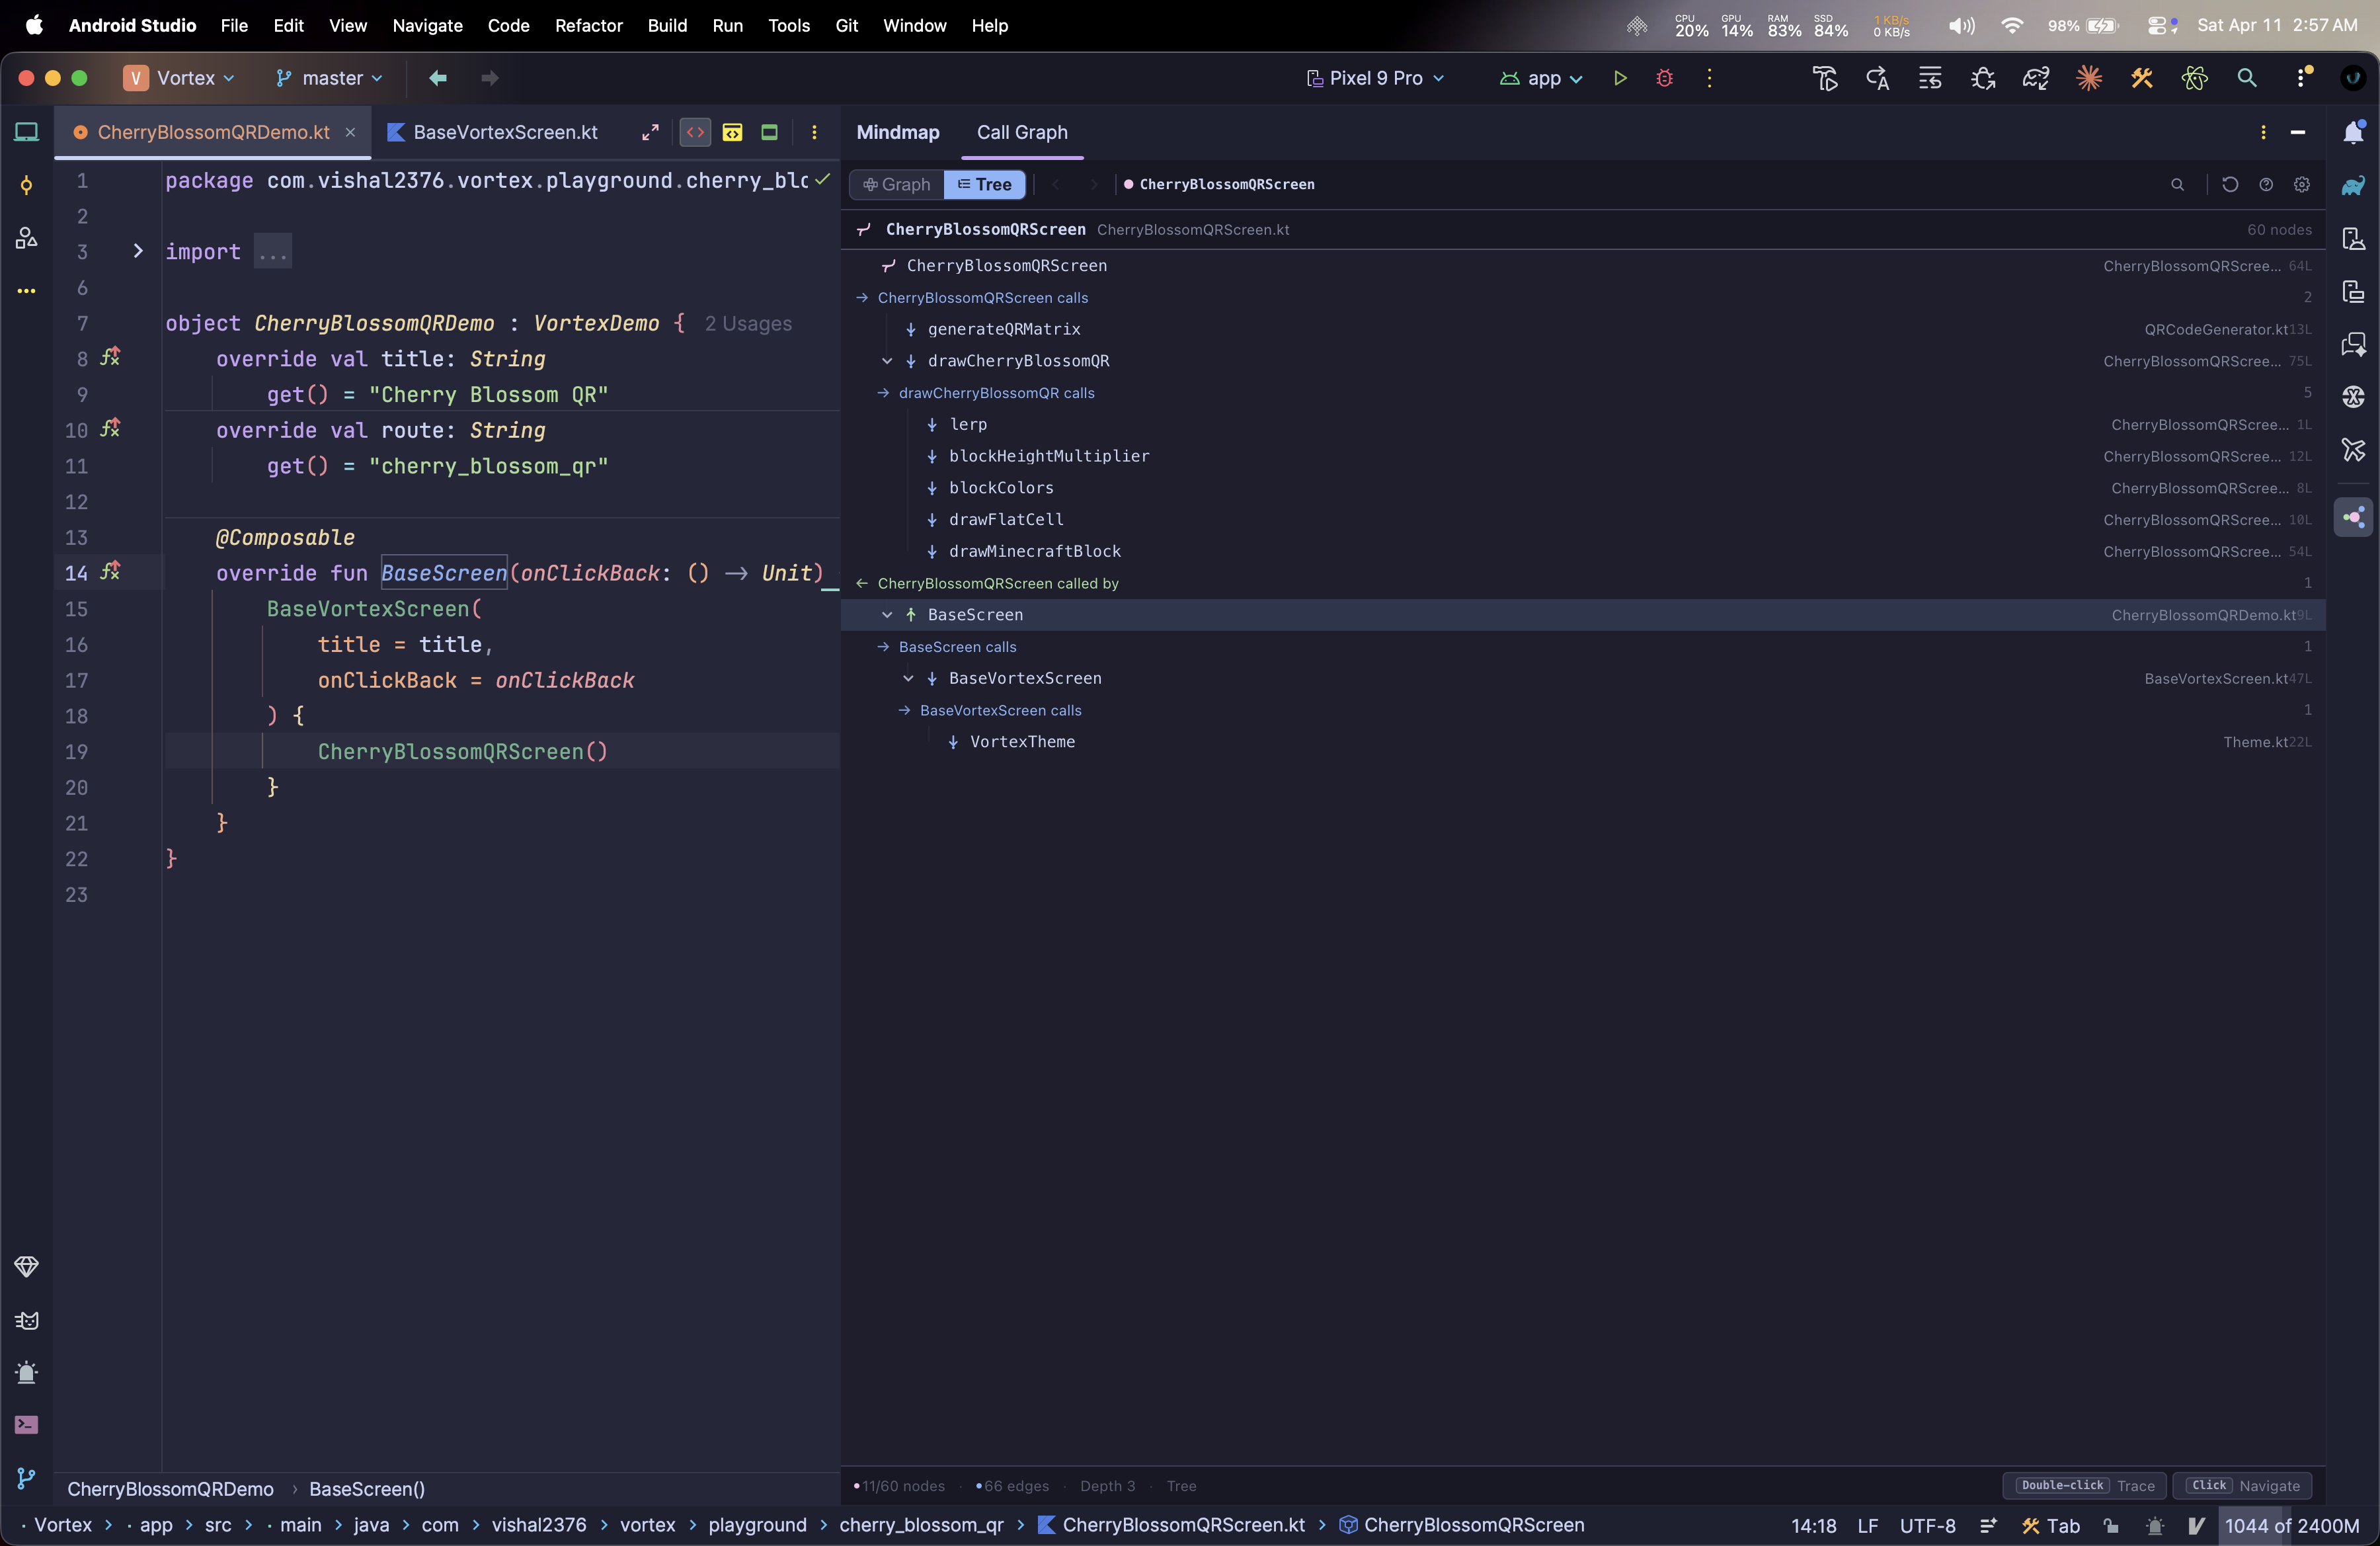
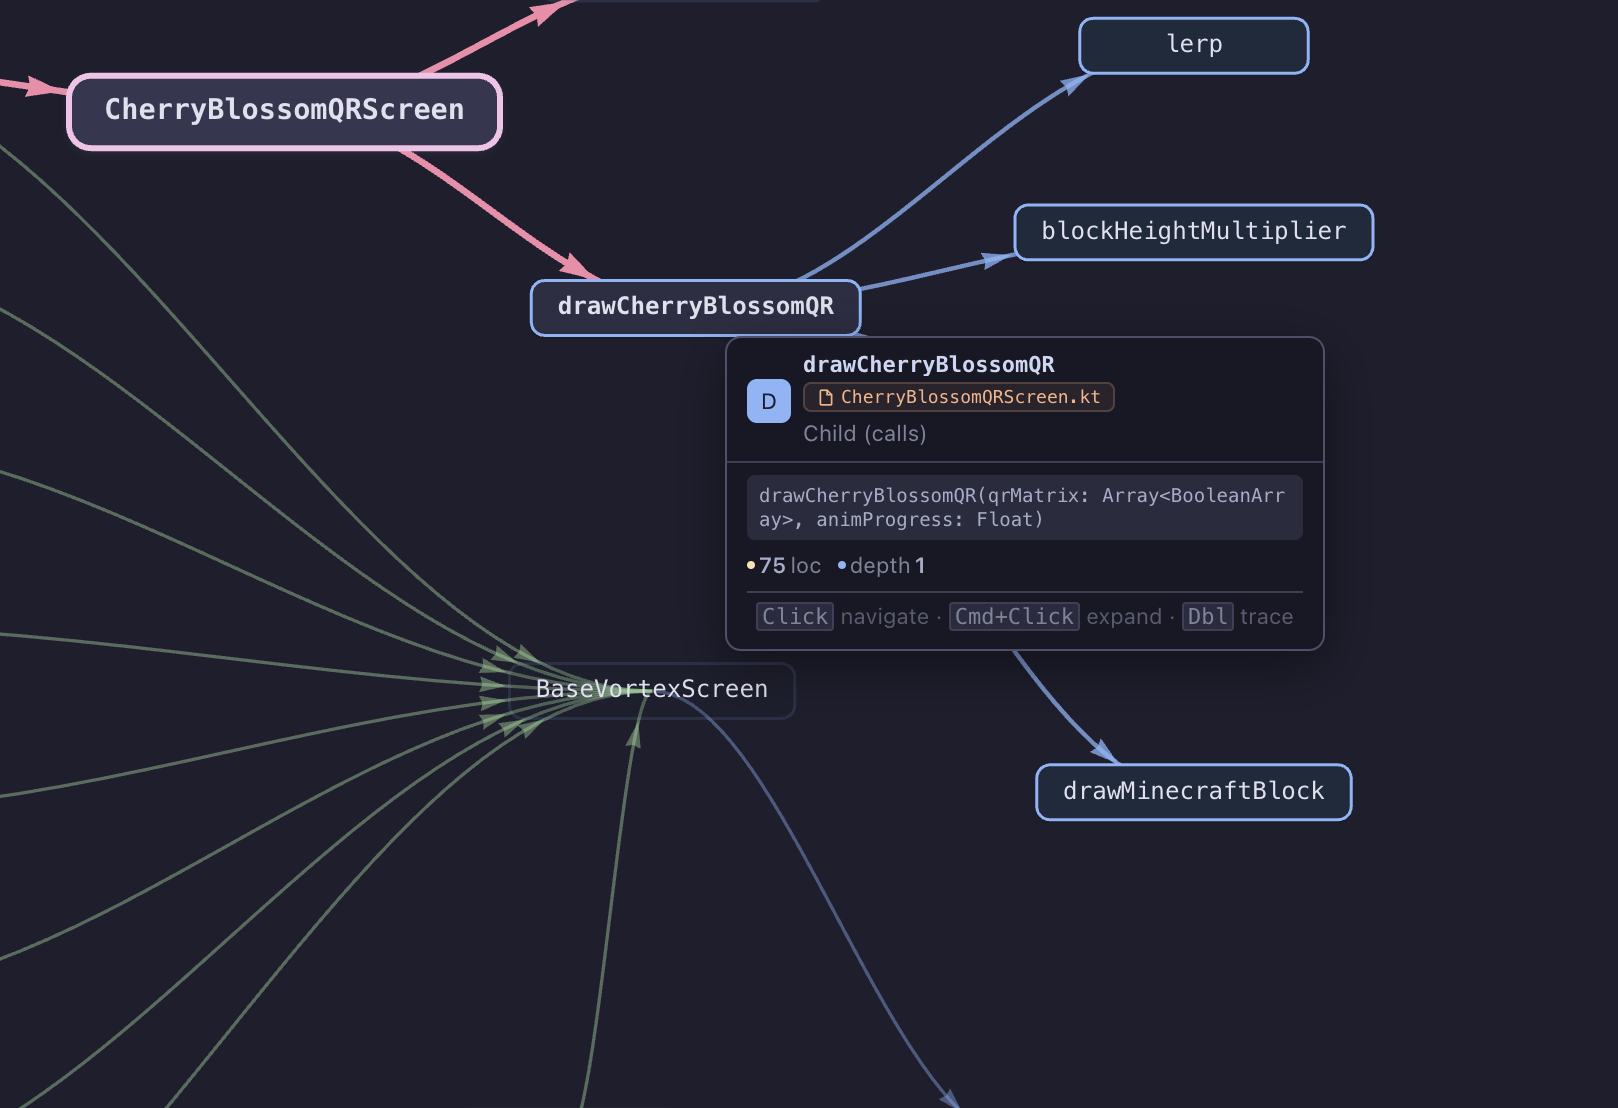
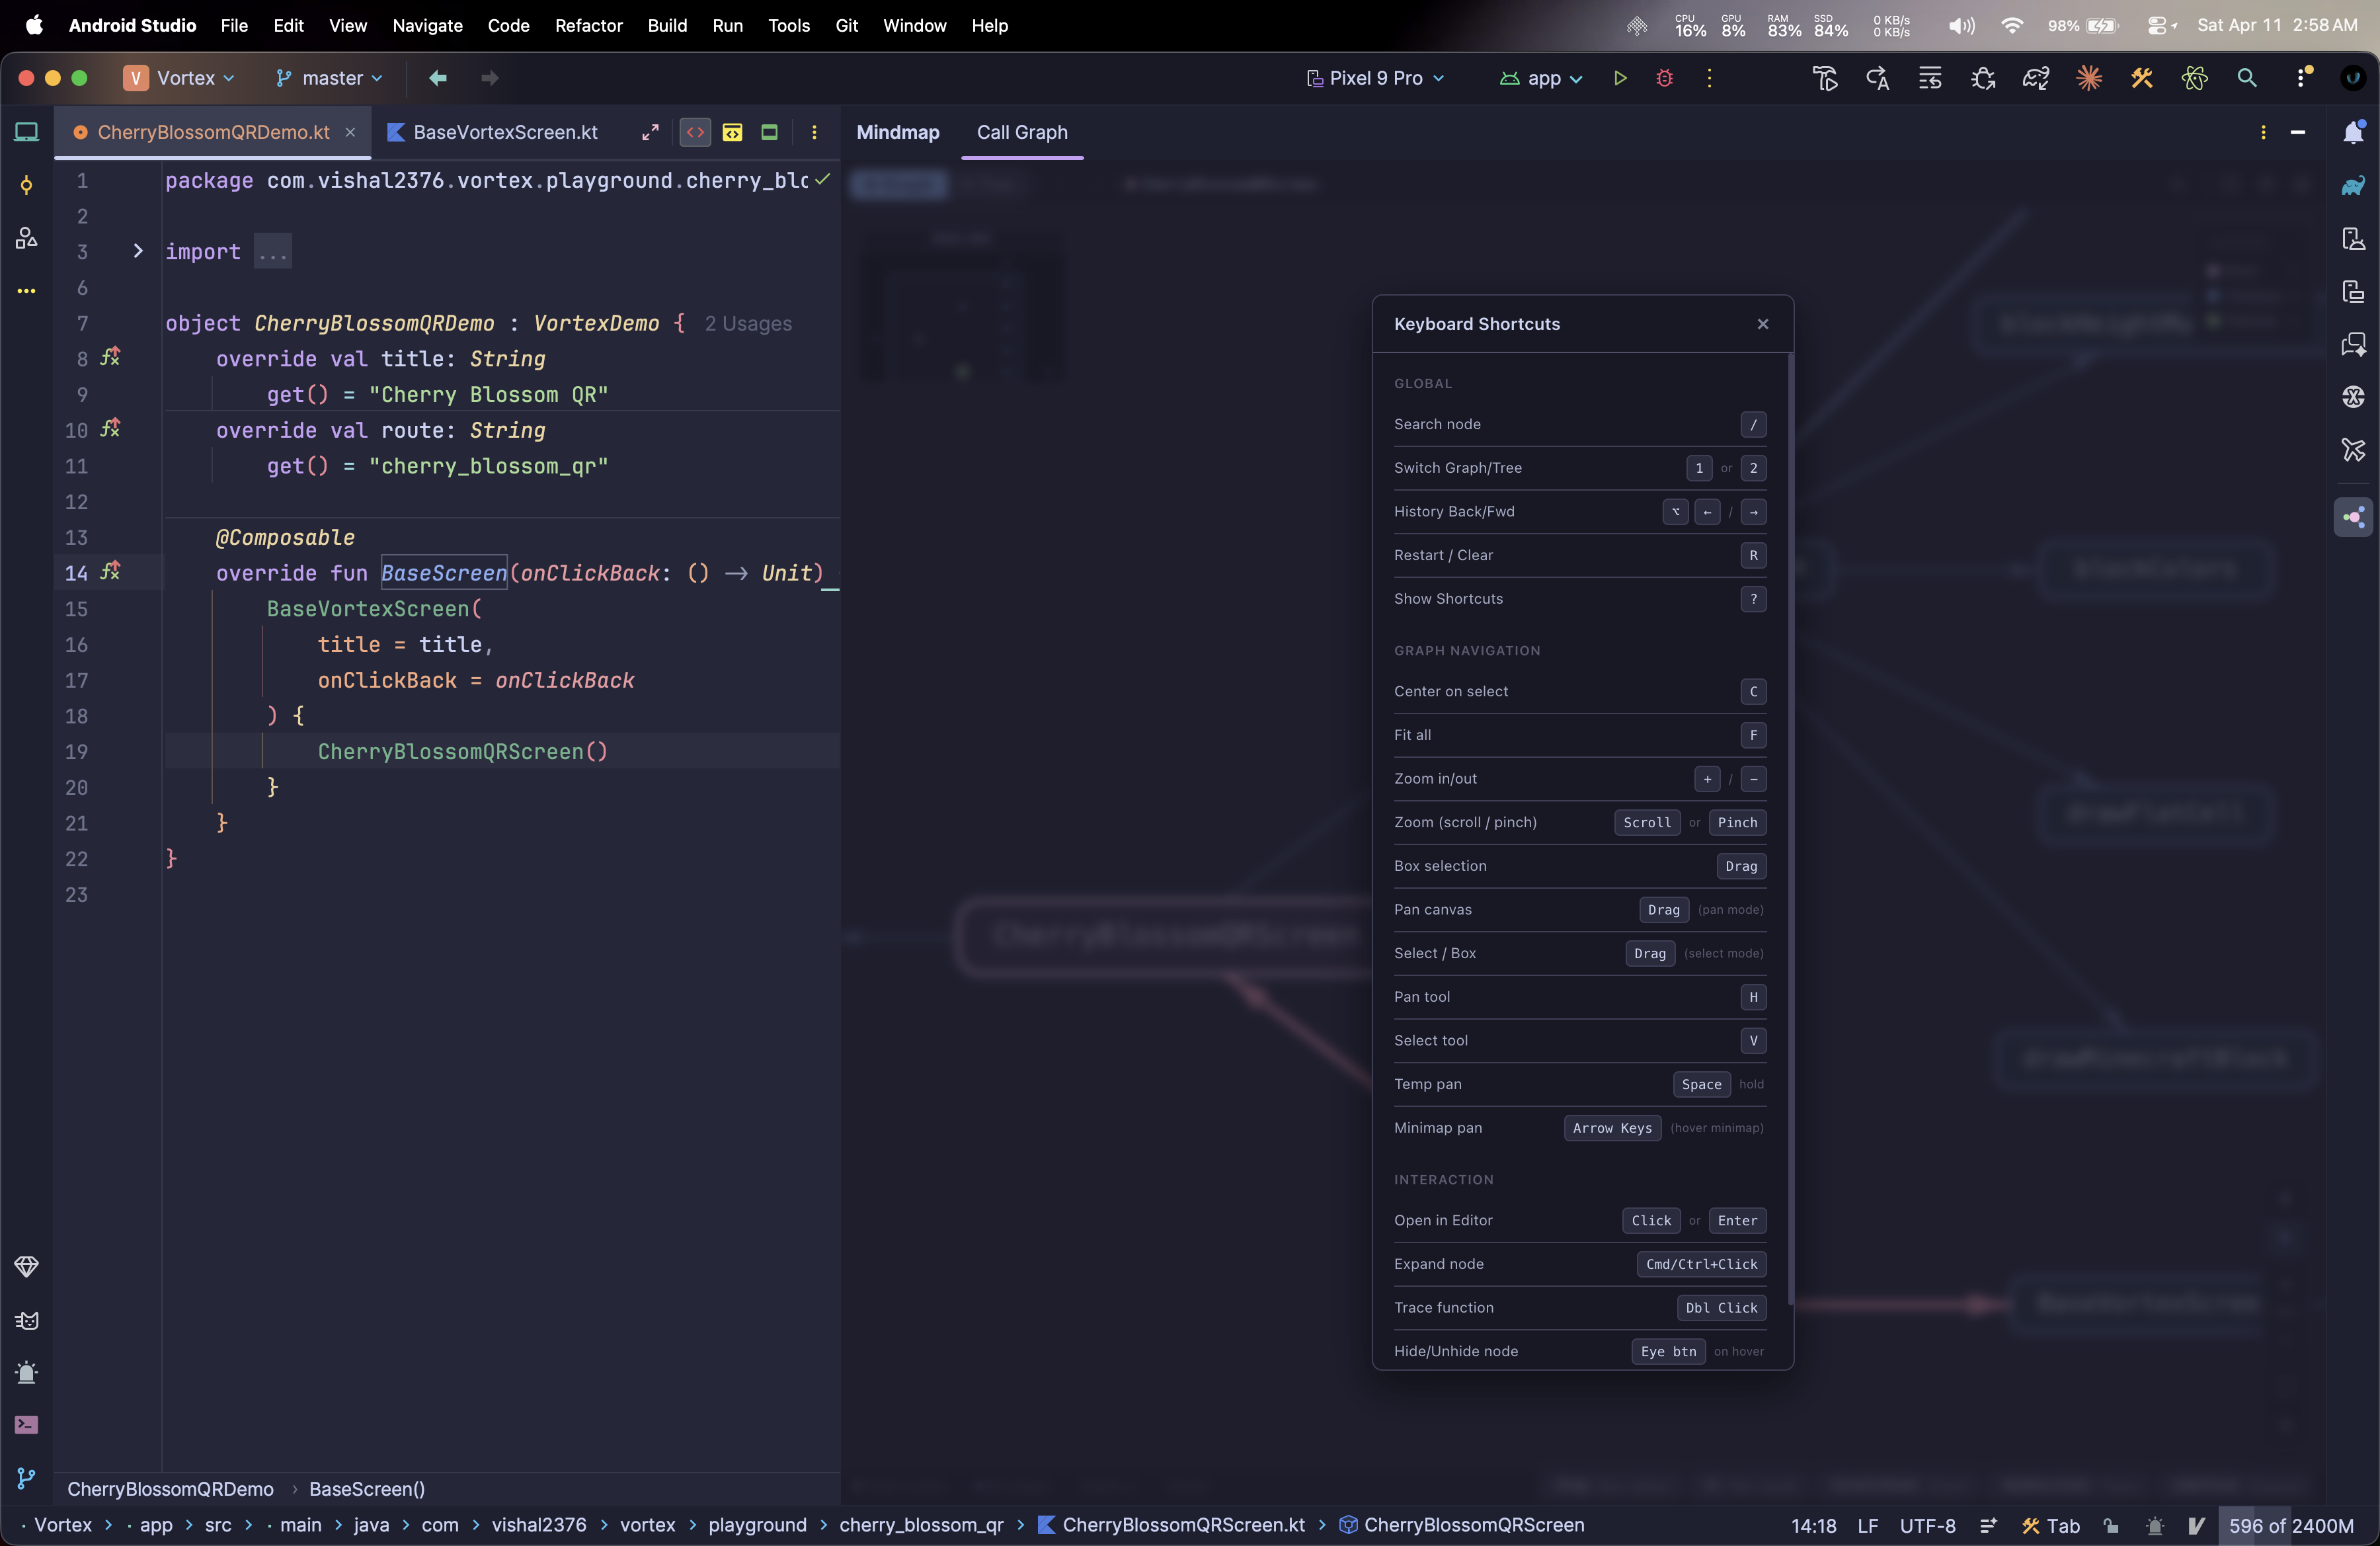
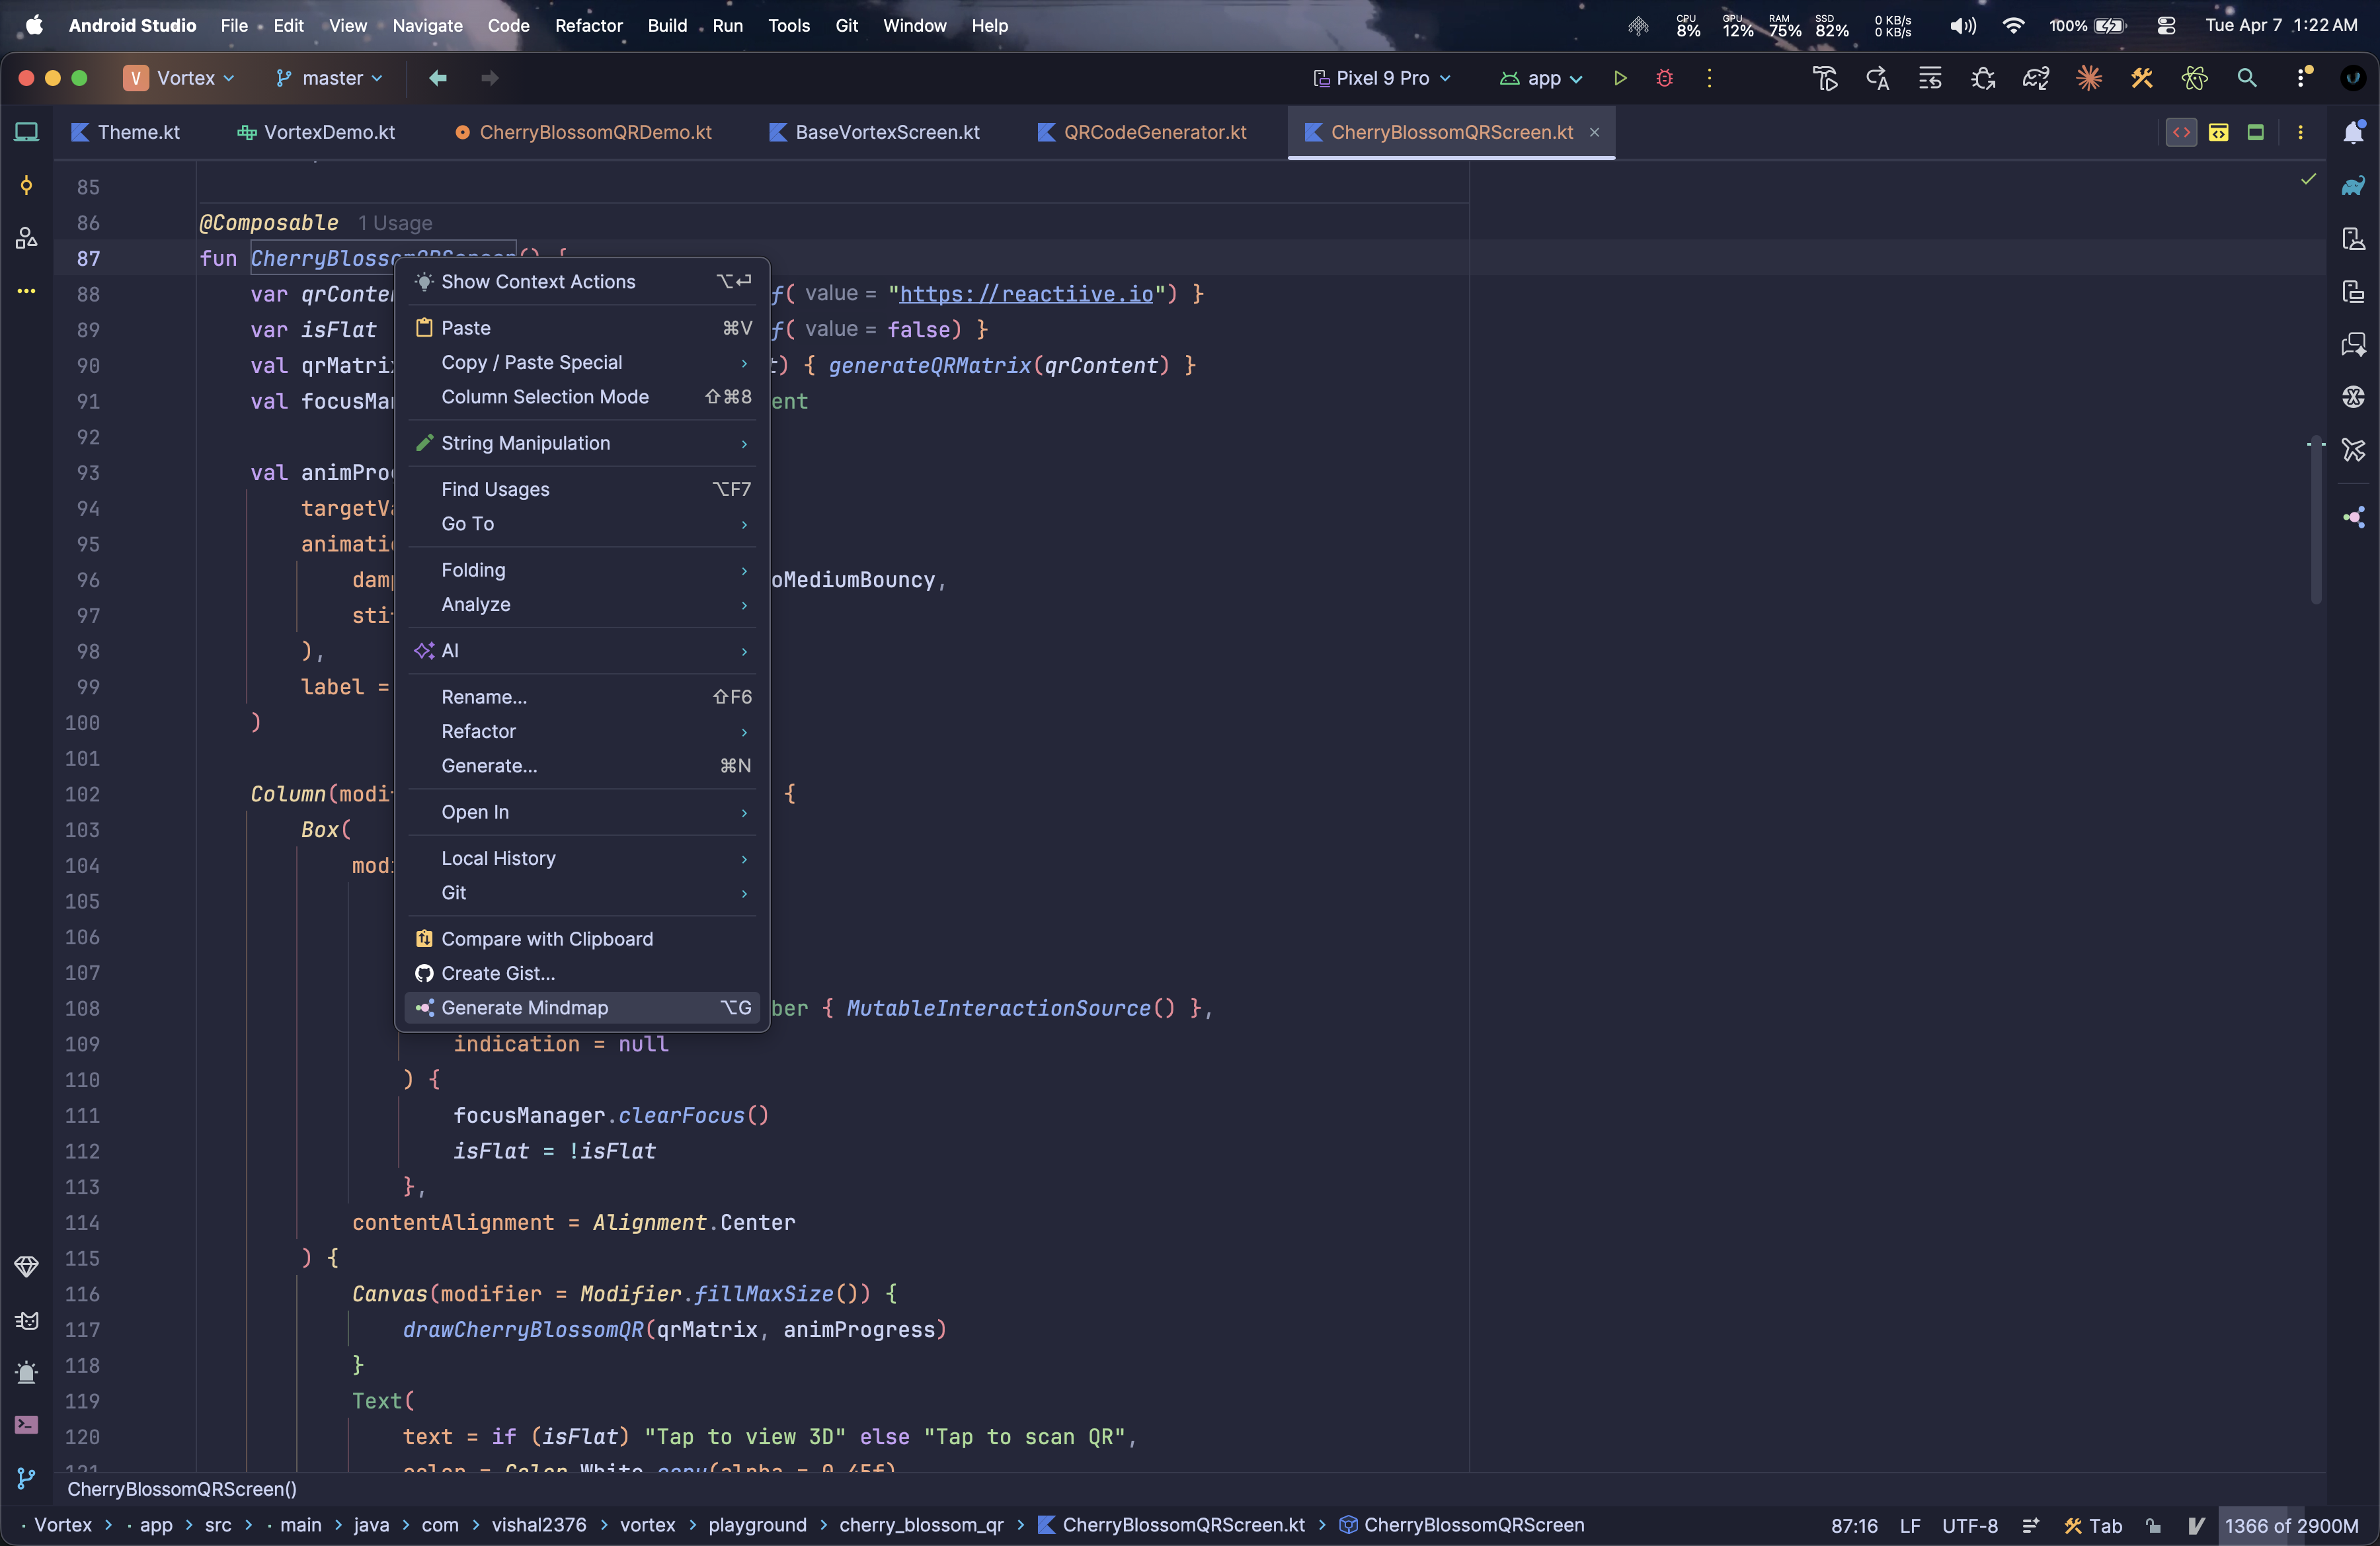
Mindmap generates an interactive, navigable call graph for any Kotlin function. Place your cursor inside a function body and press Alt+G to see every caller, callee, and the full call chain without switching context.

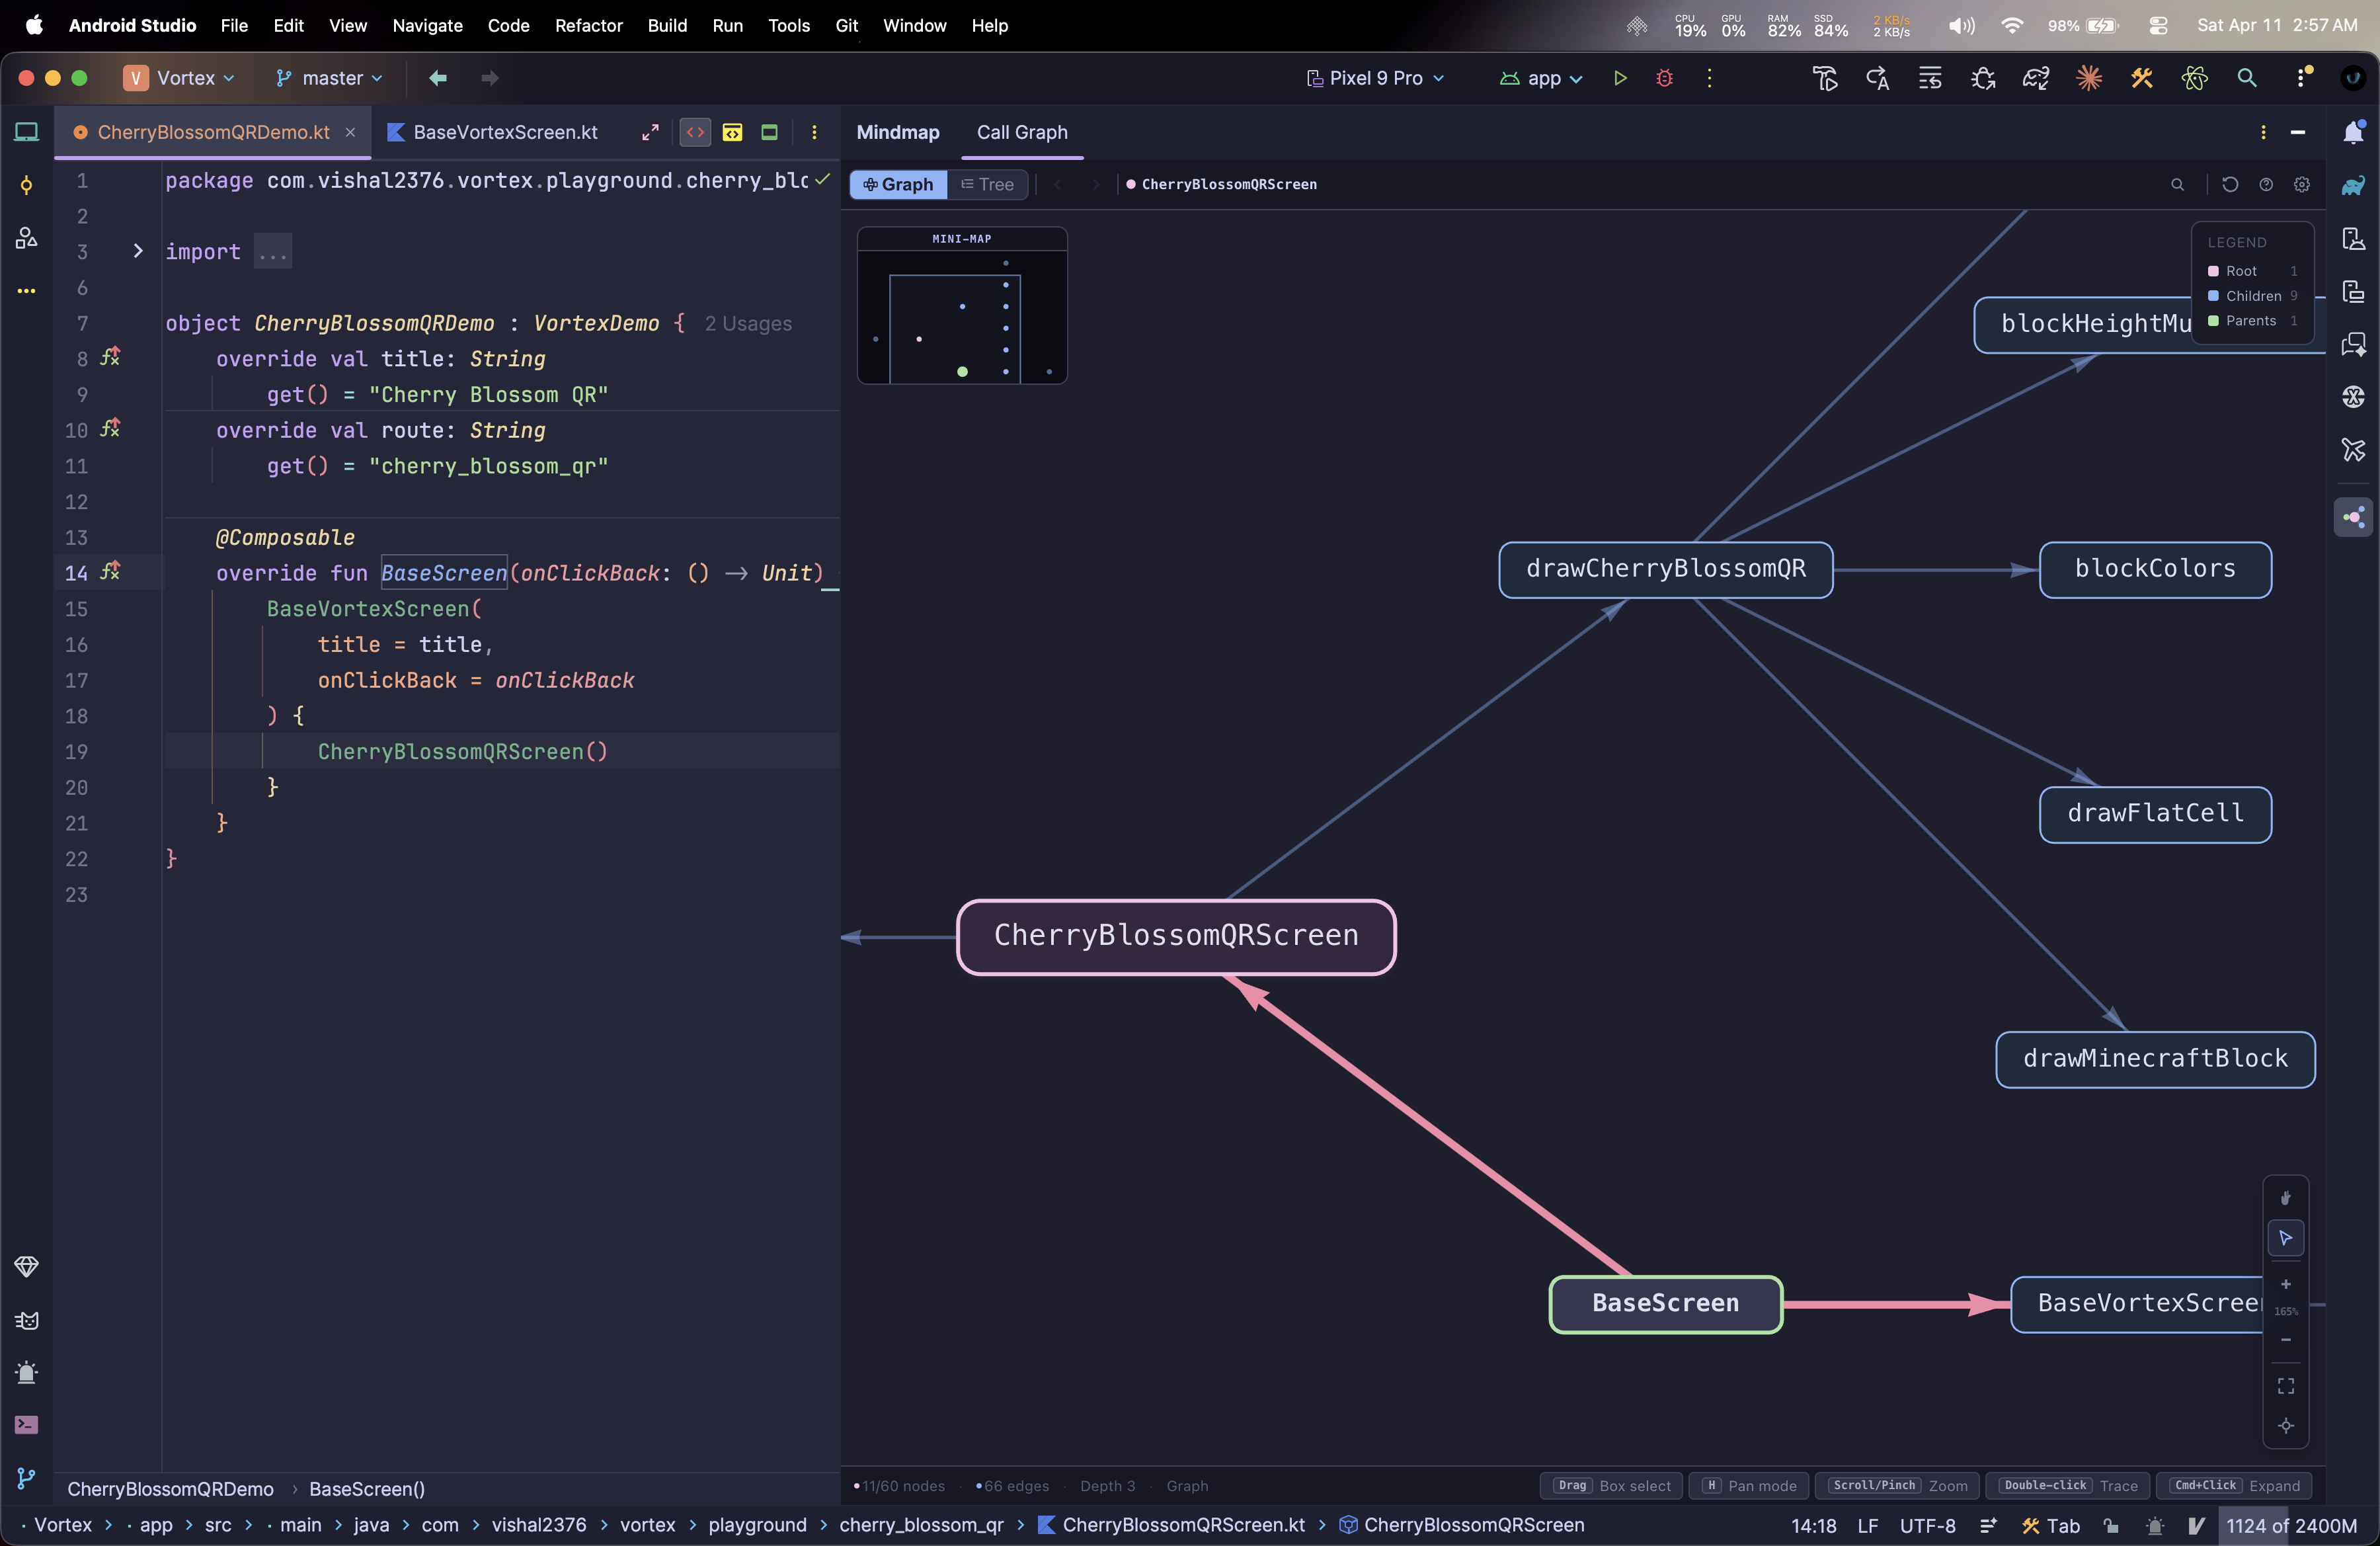
Switch between a force-directed Graph View and a collapsible Tree View. Navigate history, filter nodes, jump to source in one click.

IntelliJ IDEA 2024.3+
Android Studio Ladybug+
Mindmap call graph view

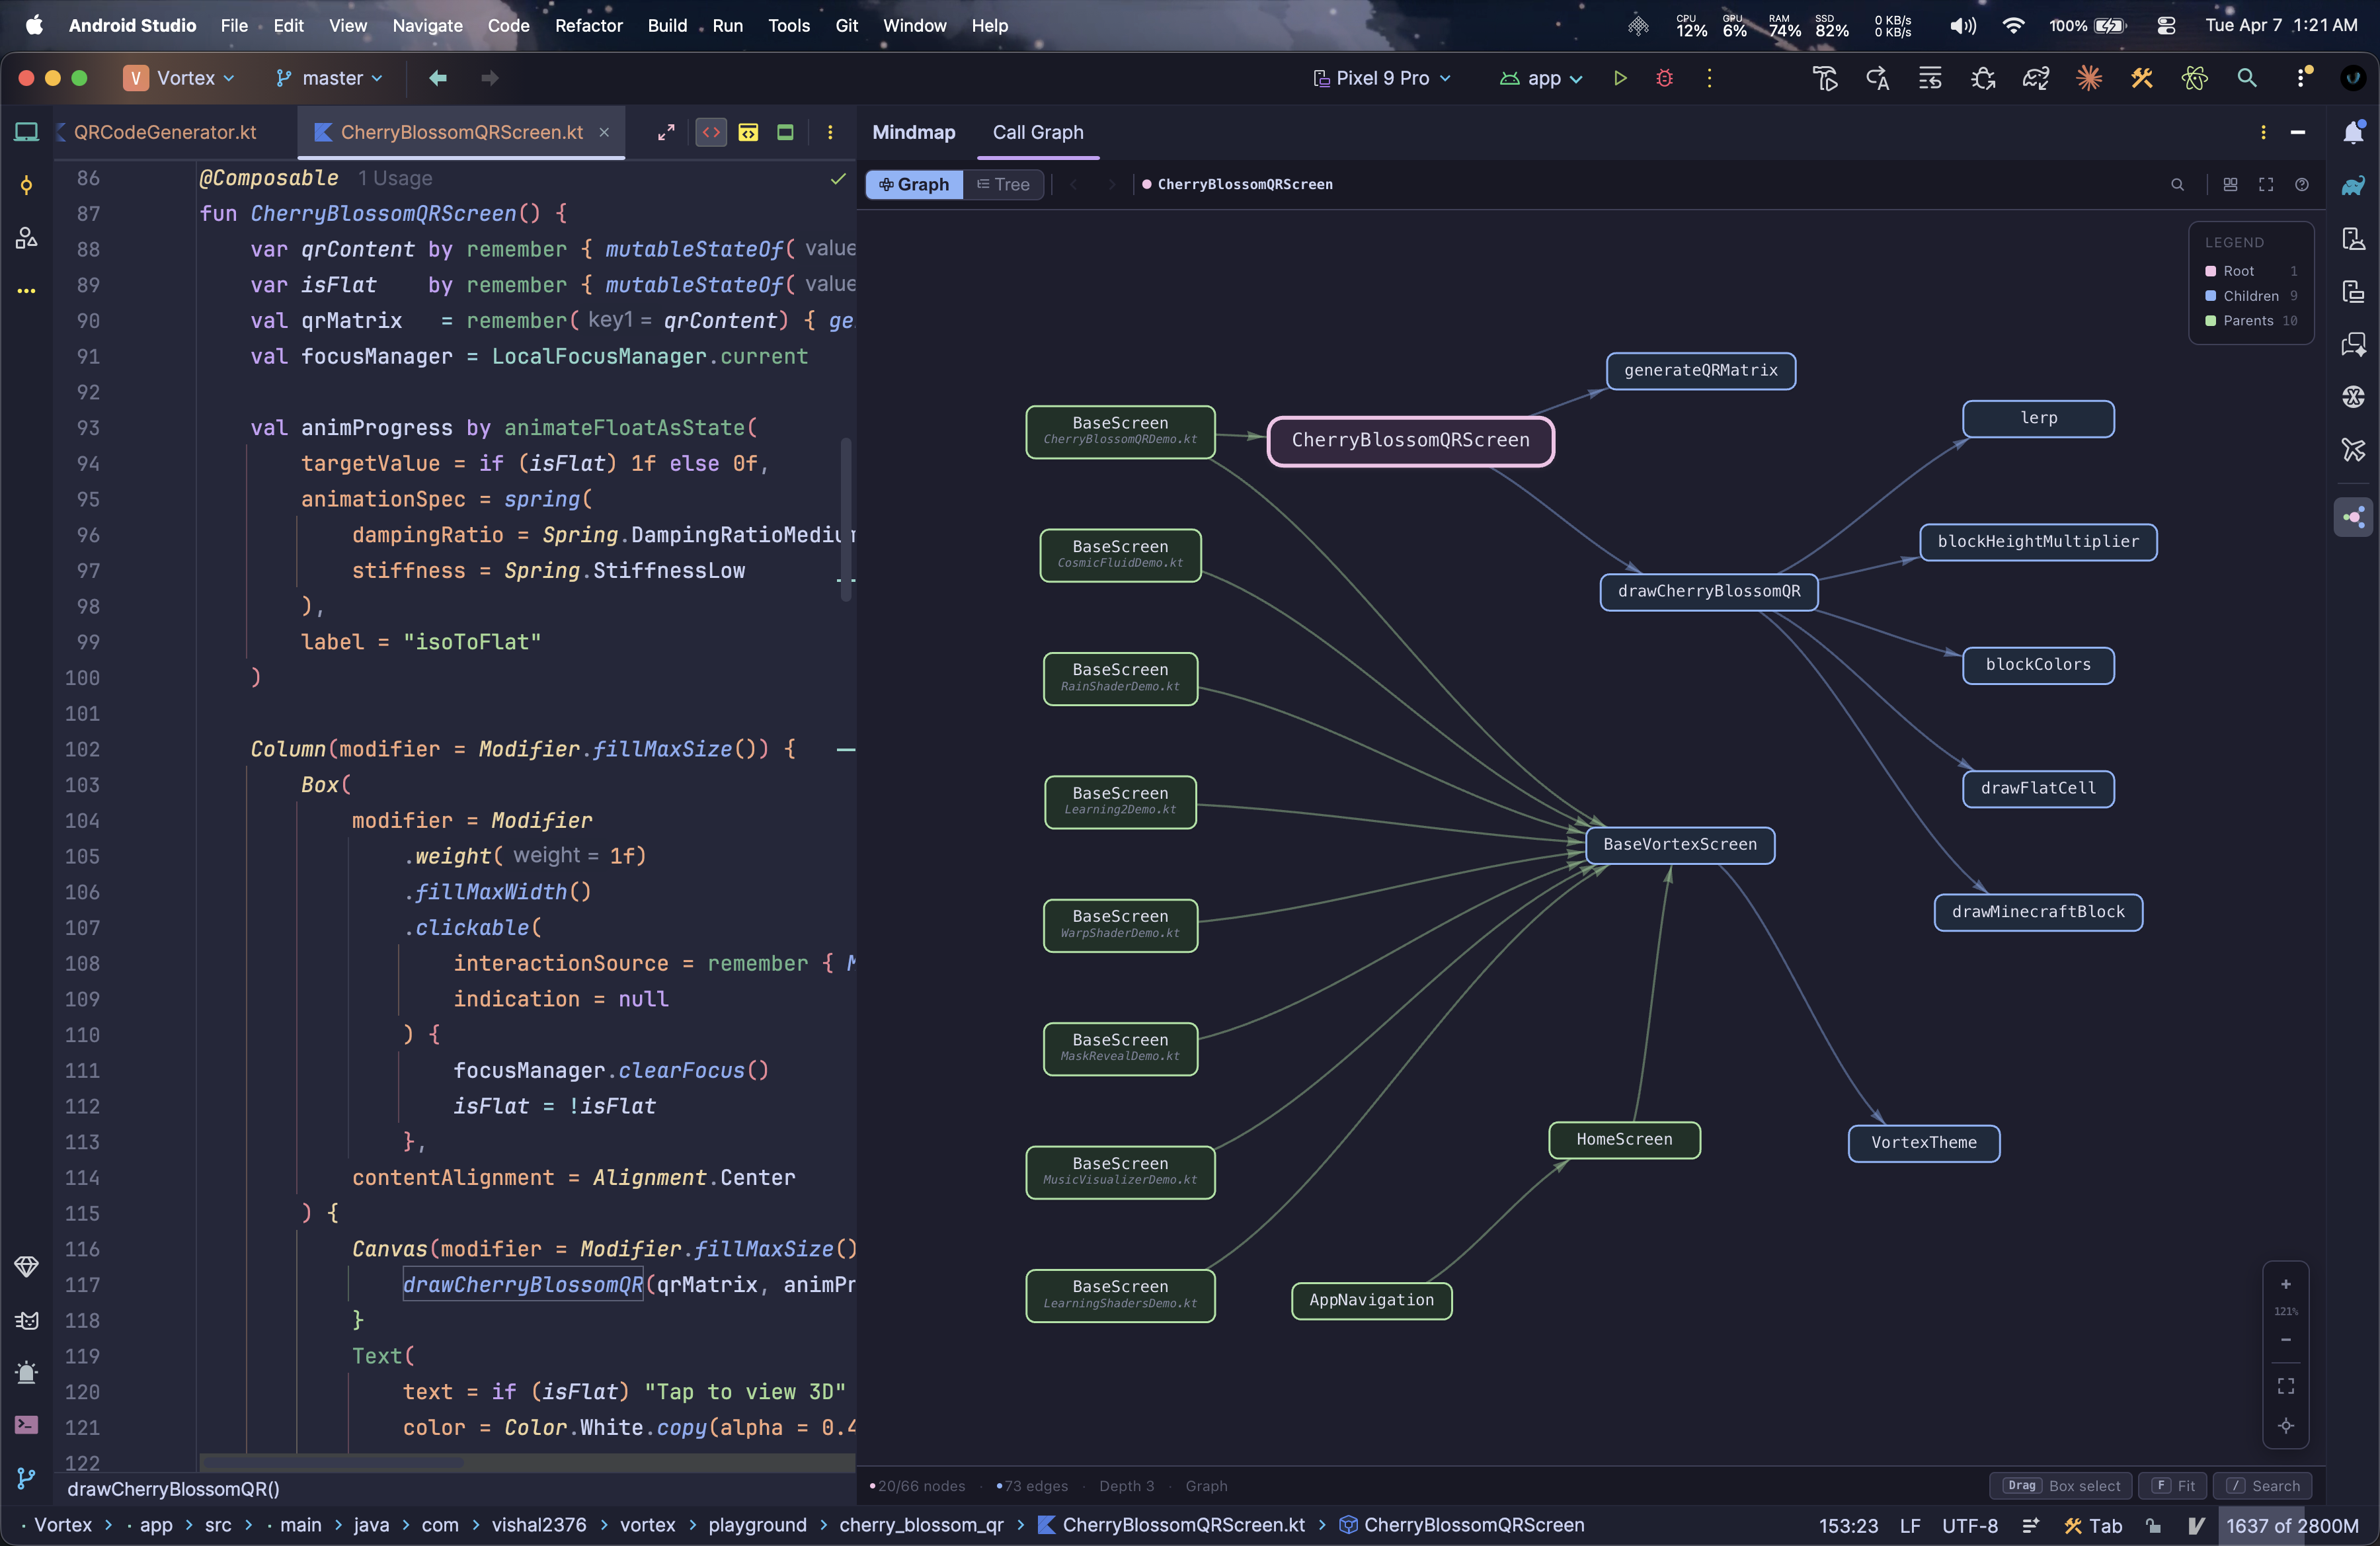
Graph view: callers left, root center, callees right


Capabilities

Key Features

Everything you need to navigate function relationships at depth.

01 · Interactive Graph

Advanced Interaction

  • Hierarchical layout: callers left, callees right
  • Live Mini-Map: VS Code-style orientation
  • Figma-style zoom: targets cursor position
  • Full pan & select tools (H / V)
  • Right-click or middle-click to pan anywhere
02 · Navigation

Tree & Multi-View

  • Collapsible Tree: IDE-native nesting style
  • Abstract Trace: find concrete implementations
  • History: Alt+← / Alt+→ across functions
  • Arrow keys to traverse parents & siblings
  • Single click or Enter jumps to source
03 · Analysis

Deep Inspection

  • Configurable Depth: 1–5 (Inbound/Outbound)
  • Hide / Unhide Nodes: declutter your view
  • Hidden Nodes Panel: bottom-left management
  • Double-click to merge subgraphs (Trace)
  • Toggle library / SDK calls on or off
04 · Engineering

Performance & Flow

  • Straight-line edges for max rendering FPS
  • Disabled shadows & animations for snappiness
  • Live search filter: press / or f
  • Hover info cards: signatures & metadata
  • Kotlin K1 & K2 compiler support

Coming Soon

Future Roadmap

What's planned next. Contributions welcome on GitHub.

Java Support

Full call graph analysis for Java methods across all IntelliJ-based IDEs.

🐍

Python Support

Call graph analysis for Python functions when the JetBrains Python plugin is installed.

📤

Export Options

Save your call graph as SVG, PNG, or JSON for documentation and sharing.

🎨

Custom Themes

Define your own color palettes to match your IDE or team's style.

💡

Custom Rules

Define custom exclusion rules or highlighting patterns for specific packages.


Screenshots

See It In Action

Graph View Tree View Minimap Tooltip Shortcuts Context Menu
Force-directed graph: callers, root, and callees

Get Started

How To Use

From install to your first call graph in under a minute.

🗂️
STEP 01

Open a Kotlin file

Open any Kotlin file in IntelliJ IDEA or Android Studio. Click inside a function body, not on the declaration line.

Cursor must be inside the function body, not on the fun keyword line.
⌨️
STEP 02

Press Alt+G

The Mindmap tool window opens instantly with the full call graph for the function at your cursor.

Or right-click → Generate Mindmap if Alt+G conflicts with another plugin.
🔍
STEP 03

Explore the graph

Click any node to jump to source. Press 1/2 to switch views. Double-click to trace deeper into a call chain.

Press ? inside the tool window to see all keyboard shortcuts.
Platform
G Alt G Generate call graph
1 / 2 Graph / Tree view
H / V Pan / Select tool
Space (hold) Temporary pan mode
R Restart / Clear graph
F / C Fit all / Center node
/ or f Open search filter
← / → Alt ← / → History back / forward
L Toggle library calls
+ / − Zoom in / out
Arrow keys Navigate or pan minimap
Enter Go to source
? Show all shortcuts
Platform
Action Effect
Click node / Enter Navigate to source code
Click Ctrl Click Expand: re-center graph on function
Double-click node Trace: merge its call graph into view
Right-drag / Middle-drag Pan the canvas
Drag on Mini-Map Continuous pan / jump to area
Space + drag Temporary pan while in select mode
Drag node (pan mode) Move the node freely
Drag empty (select mode) Box / marquee selection
Scroll / Pinch Figma-style zoom (targets cursor)

Installation

Get Started in Seconds

One click from the JetBrains Marketplace.

IntelliJ IDEA 2024.3+
Android Studio Ladybug (2024.2.1)+
Kotlin plugin enabled (bundled)

Build from source: github.com/vishal2376/mindmap →


Troubleshoot

Help & FAQ

Common issues and how to resolve them.

Plugin doesn't appear after installation?

Restart your IDE after installing. If still missing, go to Settings → Plugins → Installed and verify Mindmap is listed and enabled. Make sure your IDE is version 2024.3 or newer.

Alt+G doesn't open the call graph?

Another plugin (commonly IdeaVim) may be intercepting the shortcut. To fix:

  1. Go to Settings → Keymap and search Generate Mindmap.
  2. Assign a different key (e.g. Alt+Shift+G).

You can also right-click inside any function and choose Generate Mindmap from the context menu.

Graph is empty or shows no nodes?

Your cursor must be inside the function body, not on the declaration line or at file level. Functions with no callers or callees will show a single root node. That is expected.

Seeing "JCEF Not Available" in Android Studio?

Mindmap uses JCEF to render the interactive graph. IntelliJ IDEA always includes JCEF. This error mainly affects Android Studio, which sometimes ships without it.

Fix: switch to a JCEF-enabled runtime

  1. Press Cmd+Shift+A (Mac) or Ctrl+Shift+A (Win/Linux) → Find Action.
  2. Search Choose Boot Java Runtime for the IDE → press Enter.
  3. Select a runtime with JCEF in its name and click OK.
  4. IDE restarts automatically. Then press Alt+G again.
If no JCEF runtime appears, update Android Studio to Ladybug (2024.2.1) or newer.
Graph cuts off or shows too few nodes?

By design, call graphs can get noisy. Use the **Settings (gear icon)** to increase Trace Depth for both inbound and outbound calls. Press L to hide library/SDK calls, which significantly reduces noise. For specific nodes, use Cmd+Click to re-center or double-click to trace deeper.

Double-click (Trace) doesn't work?

Trace mode is only available in Graph View. Press 1 to switch to Graph View, then double-click any node to merge its call graph into the current view.